


How much extra in federal government spending will the Patient Protection and Affordable Care Act cost each American each year from now through 2022?
To find out, we extracted the annual gross spending figures the Congressional Budget Office just updated for each year from 2012 through 2022 and divided those figures by the U.S. Census’ projections of the total population of the U.S. for each of those years.
The results of that math are presented in the chart below:
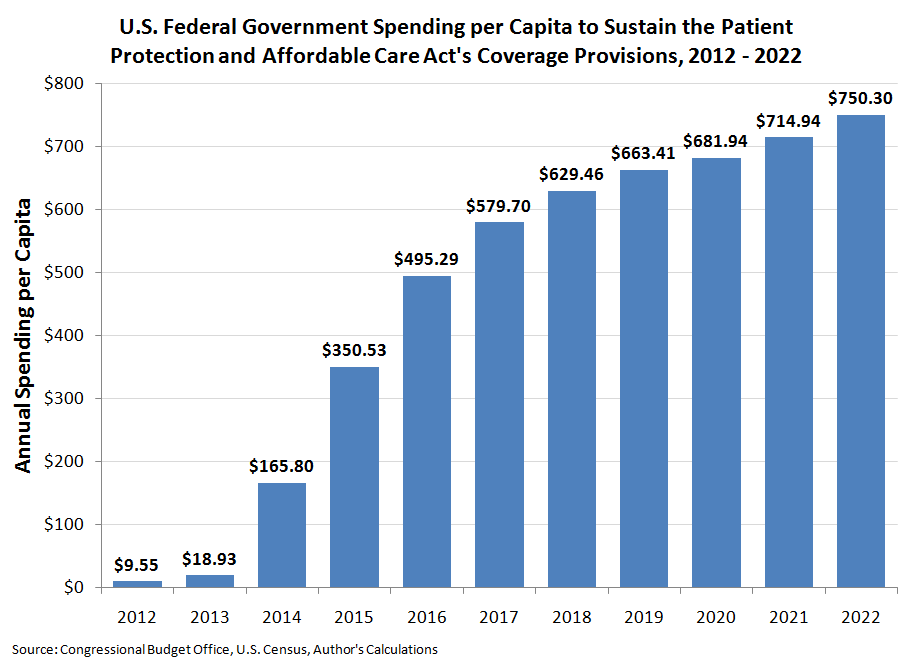
All in all, from 2012 through 2022, the CBO currently projects that the U.S. federal government will consume $1.682 trillion dollars in new spending to sustain the program.
Data Sources
Congressional Budget Office. Estimates for the Insurance Coverage Provisions of the Affordable Care Act Updated for the Recent Supreme Court Decision. Table 4. Estimate of the Budgetary Effects of the Insurance Coverage Provisions Contained in the Affordable Care Act, Updated for Supreme Court Decision. [PDF document]. 24 July 2012.
U.S. Census. U.S. Population Projections. State Interim Population Projections by Age and Sex: 2004-2030. File 1. Annual projections of total population, male, and female. [CSV File]. Accessed 3 August 2012.
 |
 |
 |
 |