


Now that the U.S. Census has released its newest estimate of median household income in the United States, it’s time to consider where the U.S. federal government spending per U.S. household stands with respect to the Zero Deficit Line, which is the amount of spending that the typical American household can actually afford. The chart below shows those two measures for each year since 1967, when the Census first began reporting its median household income figure:
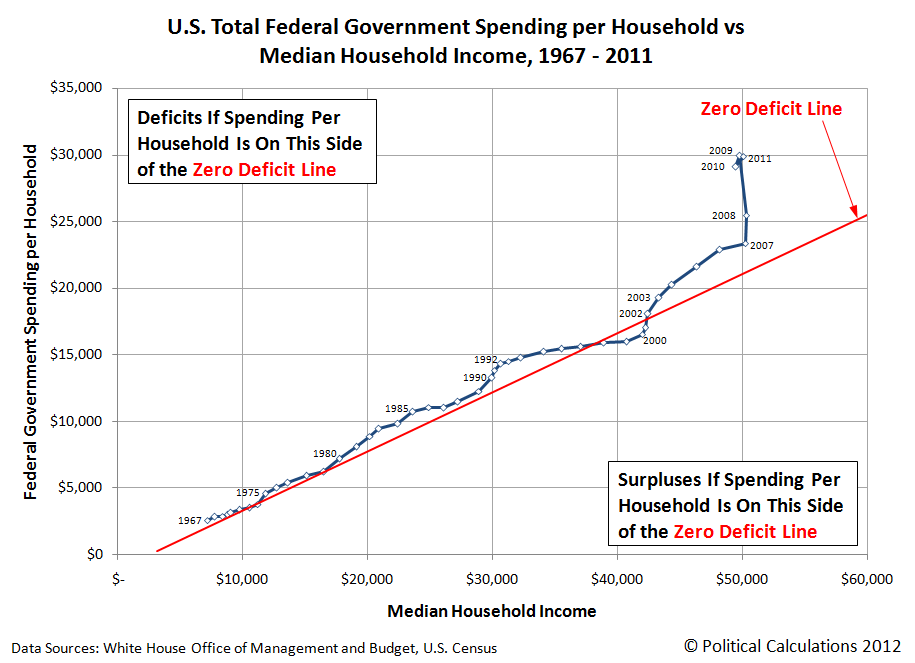
Looking at the chart, we see that median household income would appear to be mostly stuck where it has been since 2007, but for the third year in a row, the amount of U.S. federal government spending per household has soared from where it was in 2007 to just below $30,000 per U.S. household, where it has basically been stuck in the mud for the last three years.
Meanwhile, the amount of spending that the typical American household can actually afford for the U.S. government to do based upon its 2011 income of $50,054 is just $21,056 – approximately 70% of its spending per U.S. household.
Clearly, the federal government’s spending isn’t doing anything to boost the incomes of American households. Instead, it’s just racking up massive amounts of debt that will burden those incomes far into to the future….
 |
Featured Image:
Source: Los Alamos National Laboratory |
 |
 |
 |
 |