


Not long ago, we showed how the nation of Estonia was doing austerity right in confronting its fiscal problems of recent years. Today, we’re going to show you what the United States has been doing.
As the chart below reveals, it has been pretty much anything but austerity:
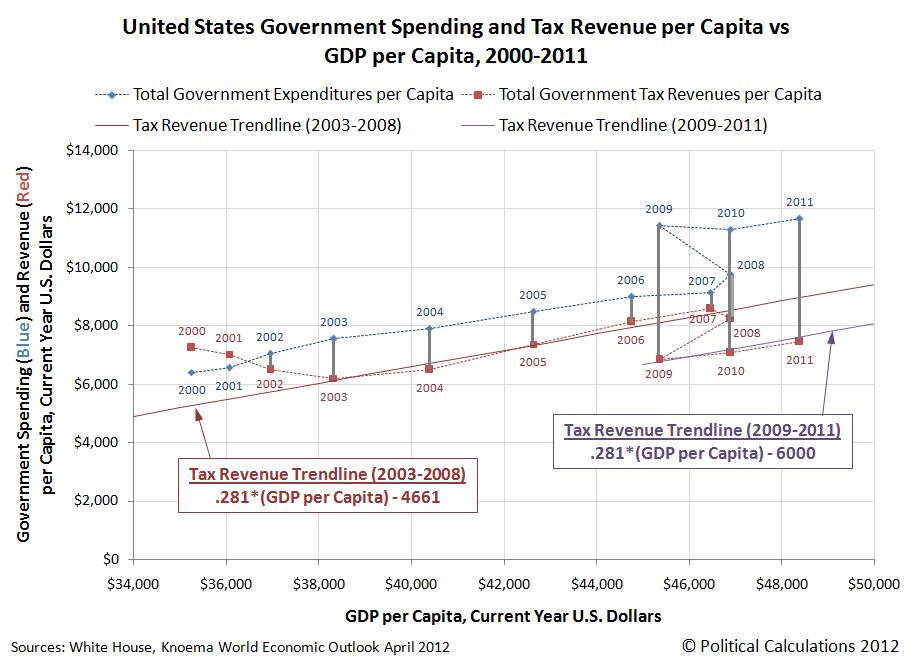
In the chart, all the values are presented in “human scale”, with the U.S.’ total tax collections, federal government spending and GDP expressed as “per Capita” values for each year from 2000 through 2011.
Starting with the year 2000, we see the effect of the Dot Com stock market bubble upon the U.S. government’s fiscal situation. With the peak of that bubble in 2000, the federal government’s total tax collections start in the chart above from an elevated point, as the U.S. Treasury benefited from the outsize contribution of capital gains taxes to the nation’s coffers.
But those capital gains evaporated with the deflation phase of the U.S. stock market bubble, which ran through June 2003. Worse, they became capital losses, which quickly depressed the government’s income tax collections, which we see in the falling level of total tax collections per capita through 2003. [On a side note, we should observe that the Dot Com stock market bubble was both created by, and ended by, actions of the U.S. Congress.]
Meanwhile, the federal government’s spending ticked upward, and the U.S. government’s budget swung from surplus to deficit during the years from 2000 to 2003, with the annual budget deficit opening up to its widest point in 2003.
With the end of the deflation phase of the Dot Com Bubble in 2003, the federal government’s fiscal situation began to improve, as its total tax collections were no longer being negatively affected by capital losses in the stock market, as the government’s total tax collections began to rise steadily through the year 2007. With the improving economy, the rate of spending growth also slowed, and the size of the government’s annual budget deficits began to fall.
Up until 2008, when financial crises stemming from the popping of the U.S. housing bubble and a very large spike in gasoline prices sent the nation’s economy into deep recession. 2008 saw a large increase in federal spending at the same time the government’s tax collections began to fall, opening up the nation’s budget deficit.
But it’s the years of 2009 through 2011 that really stand out in the chart. Here, we see the federal government’s spending skyrocket in 2009, with only a modest cut in 2010 before resuming rising and reaching its highest level on the chart in 2011. This outsize level of spending coincides with President Obama’s entire tenure in office and reflects his vision for the growth of government.
At the same time, we see the U.S.’ total tax collections fall in 2009, before following a new, parallel trajectory to what they did in the years from 2003 through 2008, as the deep recession the nation had entered came to its end in June 2009.
That’s remarkable, given that the nation’s income tax rates have not changed during this time – with the nation generating similar levels of GDP as it did in the years before the recession, the U.S. Treasury should be collecting an equivalent amount of taxes.
The reason why the U.S. tax collections are at a depressed level, despite no longer being in recession, are the tax cuts President Obama has implemented during his time in office. Beginning with the President’s “Making Work Pay” tax credit, and the later Social Security payroll tax cut, which reduced the taxes paid by people making less than 110,100 per year (in terms of 2011 inflation-adjusted dollars).
The problem with those targeted tax cuts, from the perspective of establishing fiscal sustainability for the government, is that roughly 80% of all the income that is earned in the United States is done by people who make less than that $110,100 figure. Thus, while benefiting up to 95% of all income earners in the U.S., the effect of the President’s tax cuts has to reduce the government’s total tax collections by roughly 17% below what they would otherwise be without them.
That’s a large price to pay for the sake of shifting the tax burden onto the nation’s top income earners, who have seen very little benefit, if any, from the President’s tax policies, and whose tax burden is set to increase even more under current law.
The combination of excessive federal spending and President Obama’s ongoing efforts to redistribute income in the U.S. has thus put the United States government onto a fiscally unsustainable path. Worse, the higher taxes waiting in the wings for high income earners will do very little to right that course.
 |
 |
 |
 |