


The first question: “Does racking up a lot of national debt hurt a country’s economic growth prospects?” The answer, via Political Calculations:
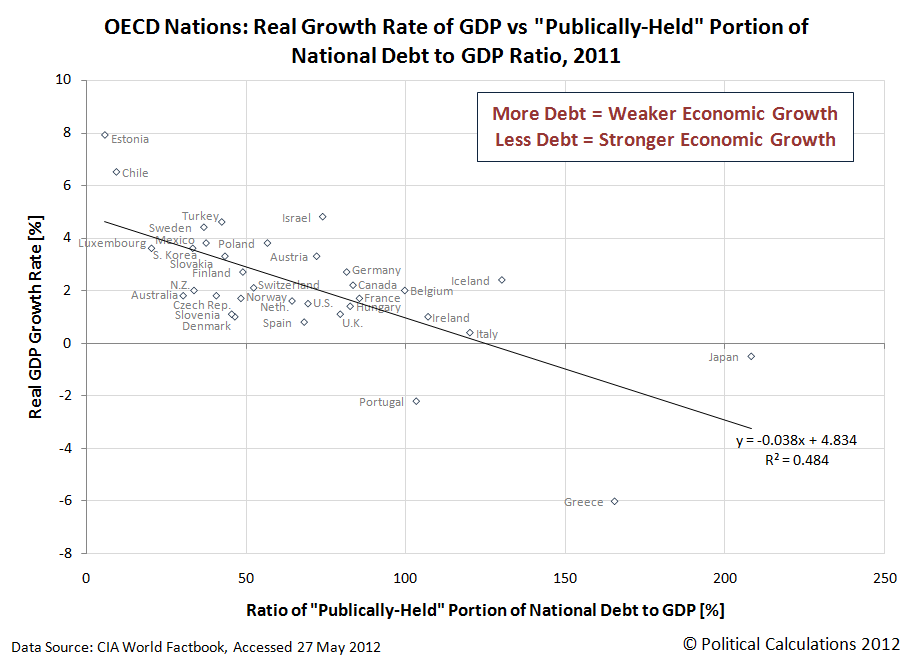
What we see is that high levels of national debt with respect to the size of a nation’s economy, would appear to have a medium-strength effect upon its real rate of economic growth. For every 10% increase in a country’s national debt with respect to its GDP, it would appear that its real economic growth rate is reduced on average by roughly 3/8th of a percent. A 26% increase in a nation’s debt-to-GDP ratio then would coincide with the shaving of a full percent off its real GDP growth rate.
That matters because economic growth is exponential. A nation whose economy grows at an average rate of 3% per year will double in size in roughly 24 years. A nation whose economy grows a full percent less than that at an average rate of 2% per year will take 36 years to double in size. The difference between the two growth rates is very noticeable.
Looking at the United States’ position on the chart, we note that the debt indicated in the chart applies only to the “publically-held” portion of its national debt – if we included the “intragovernmental” portion of its national debt, as would represent a more correct accounting of how much money the U.S. government has really borrowed, it would be over 100% of GDP in 2011.
The second question: “Does cutting government spending to rein in the growth of a country’s national debt hurt its economic growth prospects?” The answer, via AEI’s Kevin Hassett:
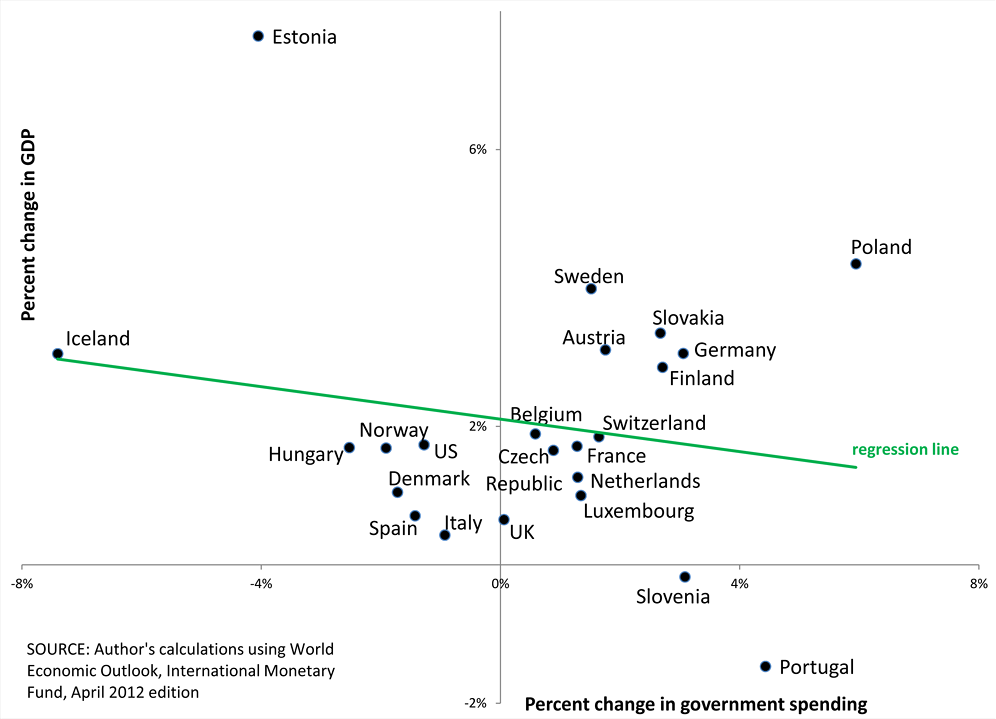
The green regression line highlights the most important takeaway from this chart: that there is no obvious relationship between a decrease in government spending and a decrease in GDP. Keynesians would expect the line to slope upward; in fact, it slopes slightly downward. But the slope of the line is not significantly different from zero (in fact, this is true whether or not the analysis includes the two outliers, Greece and Ireland).
A possible explanation is that the two effects mentioned earlier�the expectational one and the Keynesian one�cancel each other out. GDP is lower as a result of government-spending cuts, but GDP hasn�t plummeted (except in Greece, which is a story of its own) because of the positive expectational effect, the hope of better days to come.
The chart has two policy implications. First, austerity has not caused even near-term harm to countries that have undertaken it. Second, austerity is something of a free lunch. This is because, as studies (such as a 2010 paper by economists Andreas Bergh and Martin Karlsson) show, longer-run growth is higher in countries with smaller governments. Nations that reduce spending today can do so without fearing that the longer-run growth is being purchased with a costly near-term recession.
Although developed separately, and despite one showing a “medium strength” correlation and the other showing “no obvious relationship” between the things being charted, the two charts together provide a very strong argument in favor of taking action to reduce national debt by cutting government spending. And that objective would seem to go for any nation.
References
Hassett, Kevin. Cut to Grow. American Enterprise Instititute. 25 May 2012.
Political Calculations. Economic Growth and the Chains of Debt. 30 May 2012.
 |
Featured Image:
Source: Smithsonian American Art Museum |
 |
 |
 |
 |


