


How much has President Barack H. Obama grown the size of the U.S. government’s budget since coming into power in January 2009?
If we go by President George W. Bush’s final Fiscal Year 2009 budget, in which the average amount of federal government spending for each year through Fiscal Year 2013 was projected to be $2.732 trillion (in terms of inflation-adjusted, constant 2005 U.S. dollars) and compare that value to the average amount of federal spending that President Obama is currently projecting for both 2012 and 2013 of $3.185 trillion (also in terms of constant 2005 U.S. dollars), we find that President Obama has effected a permanent federal government spending increase of at least $452 billion.
Or in other terms, President Obama has permanently grown the size of the U.S. federal government’s budget by 16.5% during the four years he will have been in office by the end of his first term in office. The federal government’s spending is one-sixth bigger today than it was projected to be at this point four years ago.
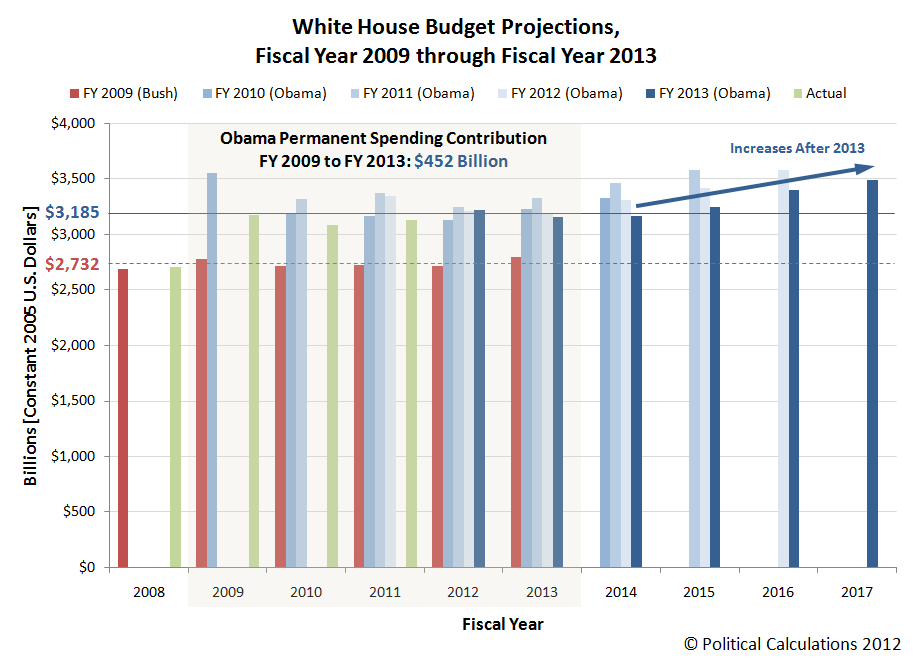
In the chart above, we can see that if President Obama had really had his way, as indicated by the amount of money he proposed to spend in his previous annual budgets, the growth of the federal government’s spending would have been even higher.
But that’s not the really scary part! We can also see in the chart above that almost all of the increase came in just President Obama’s first year in office! When the federal government was doing anything and everything it could to bail out “too big to fail” financial institutions like banks, insurers, and formerly “government-supported enterprises” like Fannie Mae and Freddie Mac, not to mention failing U.S. automakers and President Obama’s knowingly wasteful “stimulus” spending.
Since then however, as the crisis that sparked that extremely elevated amount of spending has since receded, we see that President Obama hasn’t even tried to let up on any of his spending, as one would think might be fully possible without such a crisis.
Looking beyond the President’s Fiscal Year 2013 budget, we see the same dynamic at work. Here, even though military spending is set to drastically declinewith the end of the President’s “overseas contingency operations” in both Iraq and Afghanistan, there is no real reduction in the overall level of the federal government’s spending. Any and all potential savings are being shifted to increase the President’s proposed spending on other things.
What a difference from the 1990s, when President William J. Clinton proposed budgets that saw savings from reducing the nation’s defense spending at the end of the Cold War following the failure of the former Soviet Union! There’s a reason why balanced budgets were achieved in those days….
It’s almost as if President Obama cannot bear the thought that a President ought not burden any Americans with the higher debt and taxes needed to sustain his precious spending in support of his grandiose pretentions!
References
White House Office of Management and Budget. Budget of the United States Government, Fiscal Year 2009, Historical Table 1.3�Summary of Receipts, Outlays, and Surpluses or Deficits (-) in Current Dollars, Constant (FY 2005) Dollars, and as Percentages of GDP: 1940�2013. [PDF]. Accessed 15 February 2012.
White House Office of Management and Budget. Budget of the United States Government, Fiscal Year 2010, Historical Table 1.3�Summary of Receipts, Outlays, and Surpluses or Deficits (-) in Current Dollars, Constant (FY 2005) Dollars, and as Percentages of GDP: 1940�2014. [PDF]. Accessed 15 February 2012.
White House Office of Management and Budget. Budget of the United States Government, Fiscal Year 2011, Historical Table 1.3�Summary of Receipts, Outlays, and Surpluses or Deficits (-) in Current Dollars, Constant (FY 2005) Dollars, and as Percentages of GDP: 1940�2015. [PDF]. Accessed 15 February 2012.
White House Office of Management and Budget. Budget of the United States Government, Fiscal Year 2012, Historical Table 1.3�Summary of Receipts, Outlays, and Surpluses or Deficits (-) in Current Dollars, Constant (FY 2005) Dollars, and as Percentages of GDP: 1940�2016. [PDF]. Accessed 15 February 2012.
White House Office of Management and Budget. Budget of the United States Government, Fiscal Year 2013, Historical Table 1.3�Summary of Receipts, Outlays, and Surpluses or Deficits (-) in Current Dollars, Constant (FY 2005) Dollars, and as Percentages of GDP: 1940�2017. [Excel Spreadsheet]. 13 February 2012. Accessed 15 February 2012.
 |
Featured Image:
� Political Calculations 2012 |
 |
 |
 |
 |